Website analytics is a critical part of any website growth strategy. I mean, how are you going to know if you succeeded without analyzing before and after? But the most powerful analytics tool out there can seem overwhelming to a novice user.
My goal in this post is to give you a few actionable steps to tame the Google Analytics beast. With so many options inside, it can be very hard to know where to start. For this article, I will assume you already have your website setup and it is sending data.
Step one: Filter yourself and junk data
When you first setup your analytics account, it will track all traffic on your site. This is a good and bad thing. It is good because now we know who is visiting. But it is a bad thing when you inflate your own results by browsing your website.
The second problem is junk traffic. You could see a huge spike in traffic from a county you don’t care about. Or even from a specific visitor, that shows hacker traffic. This traffic can occur in two ways. Either on your site or direct to your analytics. There seems to be a huge uptick of the latter kind of junk traffic during major events such as elections. You can also see this traffic as an odd language instead of a real one.
To get started blocking, follow the following tutorial from Google. Take it easy on the blocking, don’t go overboard.
Block an IP address – Google Analytics
Step two: Set some goals
Google Analytics contains some more advanced features which allow you to set goals. There are some built-in goals, or you can create your own. Goals help you to see conversions, and create reports to help see if you are reaching your goals. If you want more readership, setting a goal to that end will help you track how you are doing.
You can have more than one type of goal, and I would recommend setting a least a few. I do a larger goal of tracking those making contact. And a secondary goal to review conversions of a certain type such as product or service sales.
Set up your goals by following this article: Creating goals in Google Analytics
Step three: Take notes
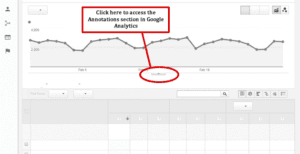
Google allows you to add annotations to your account. These can be helpful in reminding yourself of something about your traffic. Let’s say you have a daily traffic of 100 unique visitors, but last Friday you got 250. You research why and find out so and so shared your page on Twitter.
By adding an annotation to the data, you can remember exactly what happened. Or why your average was so far off that day. Because the spike will trickle downhill: month, year, etc. this will save you time later.
I do not have an eternal article on how to do this. But it is very easy to do. If you click on the arrow highlighted in the photo and the choose and date, add your note, and click save.

Step four: Set up alerts
Sometimes the basic overview does not give you the full picture of what is going on. And if you are like most people, checking your analytics daily is not a priority. In this case, I recommend setting up a few alerts.
When traffic spikes like in the example above, you need to find out why. This is important to help you track long-term trends. With an alert, you can get emails about specific events so that you can act on it. The can give you a warning about an increase in hacking activity or simple shares that went viral.
I recommend setting up at least one alert to track if you traffic spikes above normal by at least double. You can learn how to set up alerts here: Creating alerts in Google Analytics
Step five: Analyze historical trends
There is a cool feature on most pages of Google Analytics. When you are choosing a date range, you can choose a historical comparison range. This adds a second data line with the previous range superimposed on the current range. If you are trying to determine your growth between these periods, you can see what is working (or not).
The history options will help you when you are trying to determine if your goals are being reached. This feature is easy to do and will give you a good overview of what is going on from point A to point B.
Conclusion
Google Analytics is a huge beast. And there are way more options that this little article will ever cover. But with these easy steps, you can get in there and start finding some basic data. Without the overwhelming feelings. It is time to start using your analytics and learning how your website is performing.


